Infographics in10-K wraps
When they began in the late 1990’s, 10-K wraps, were short and sweet—combining (under the same cover) the plain 10-K annual report required by the SEC and a brief shareholder letter. Seemingly overnight, many U.S. companies adopted them, mostly to appease shareholders who were beginning to demand higher dividends in place of extravagant, expensive books. Once that furor died down, though, I noticed a steady uptick in lavish looking CSR reports. But that’s another story.
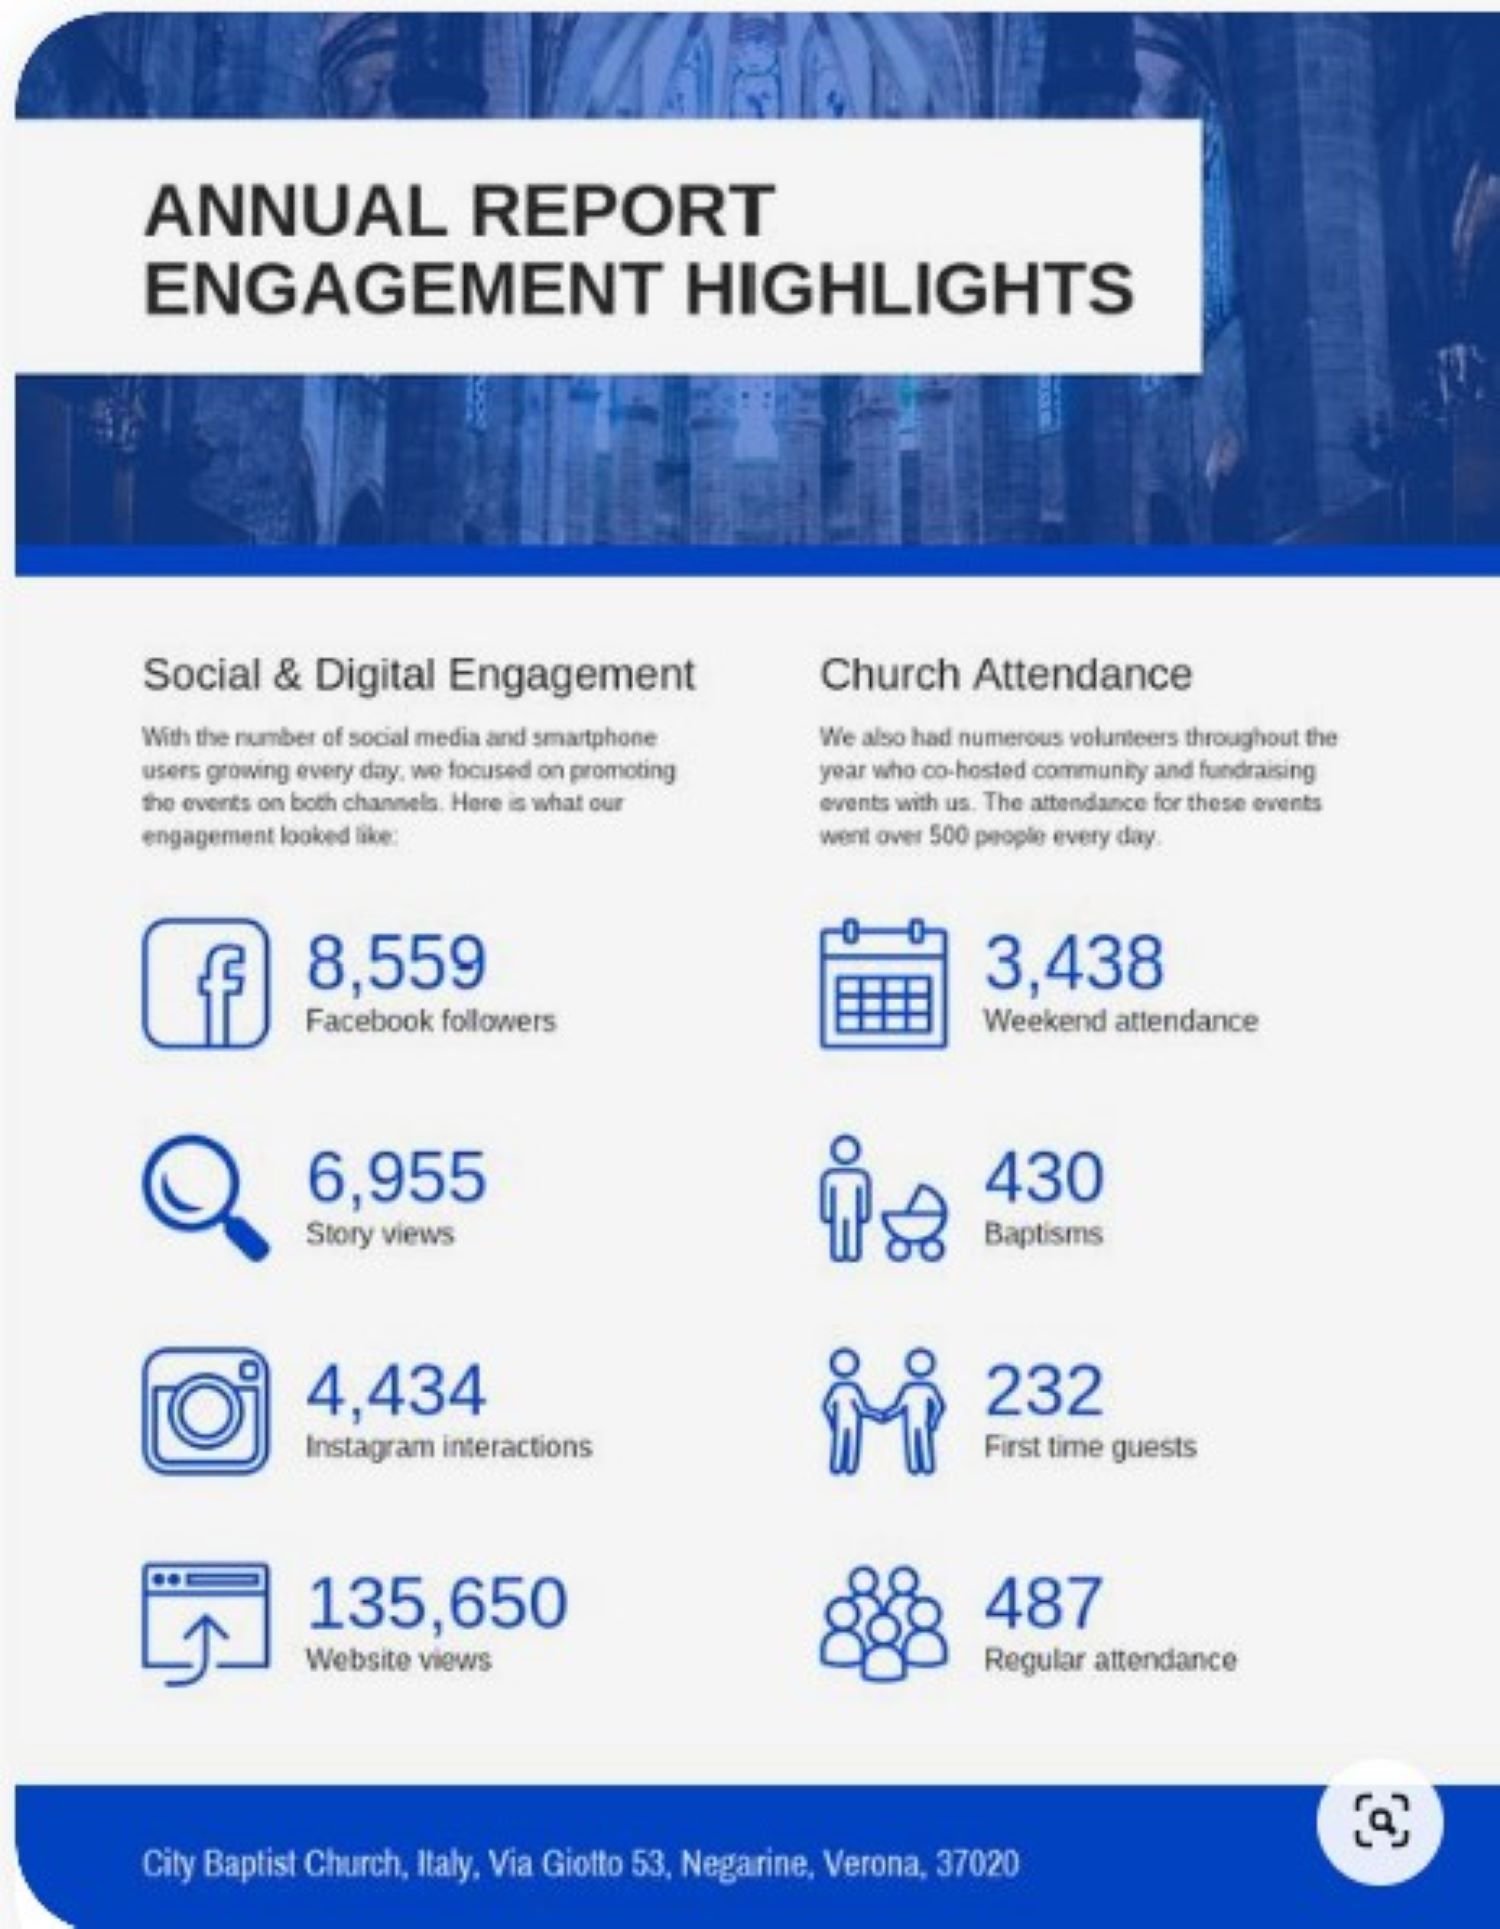
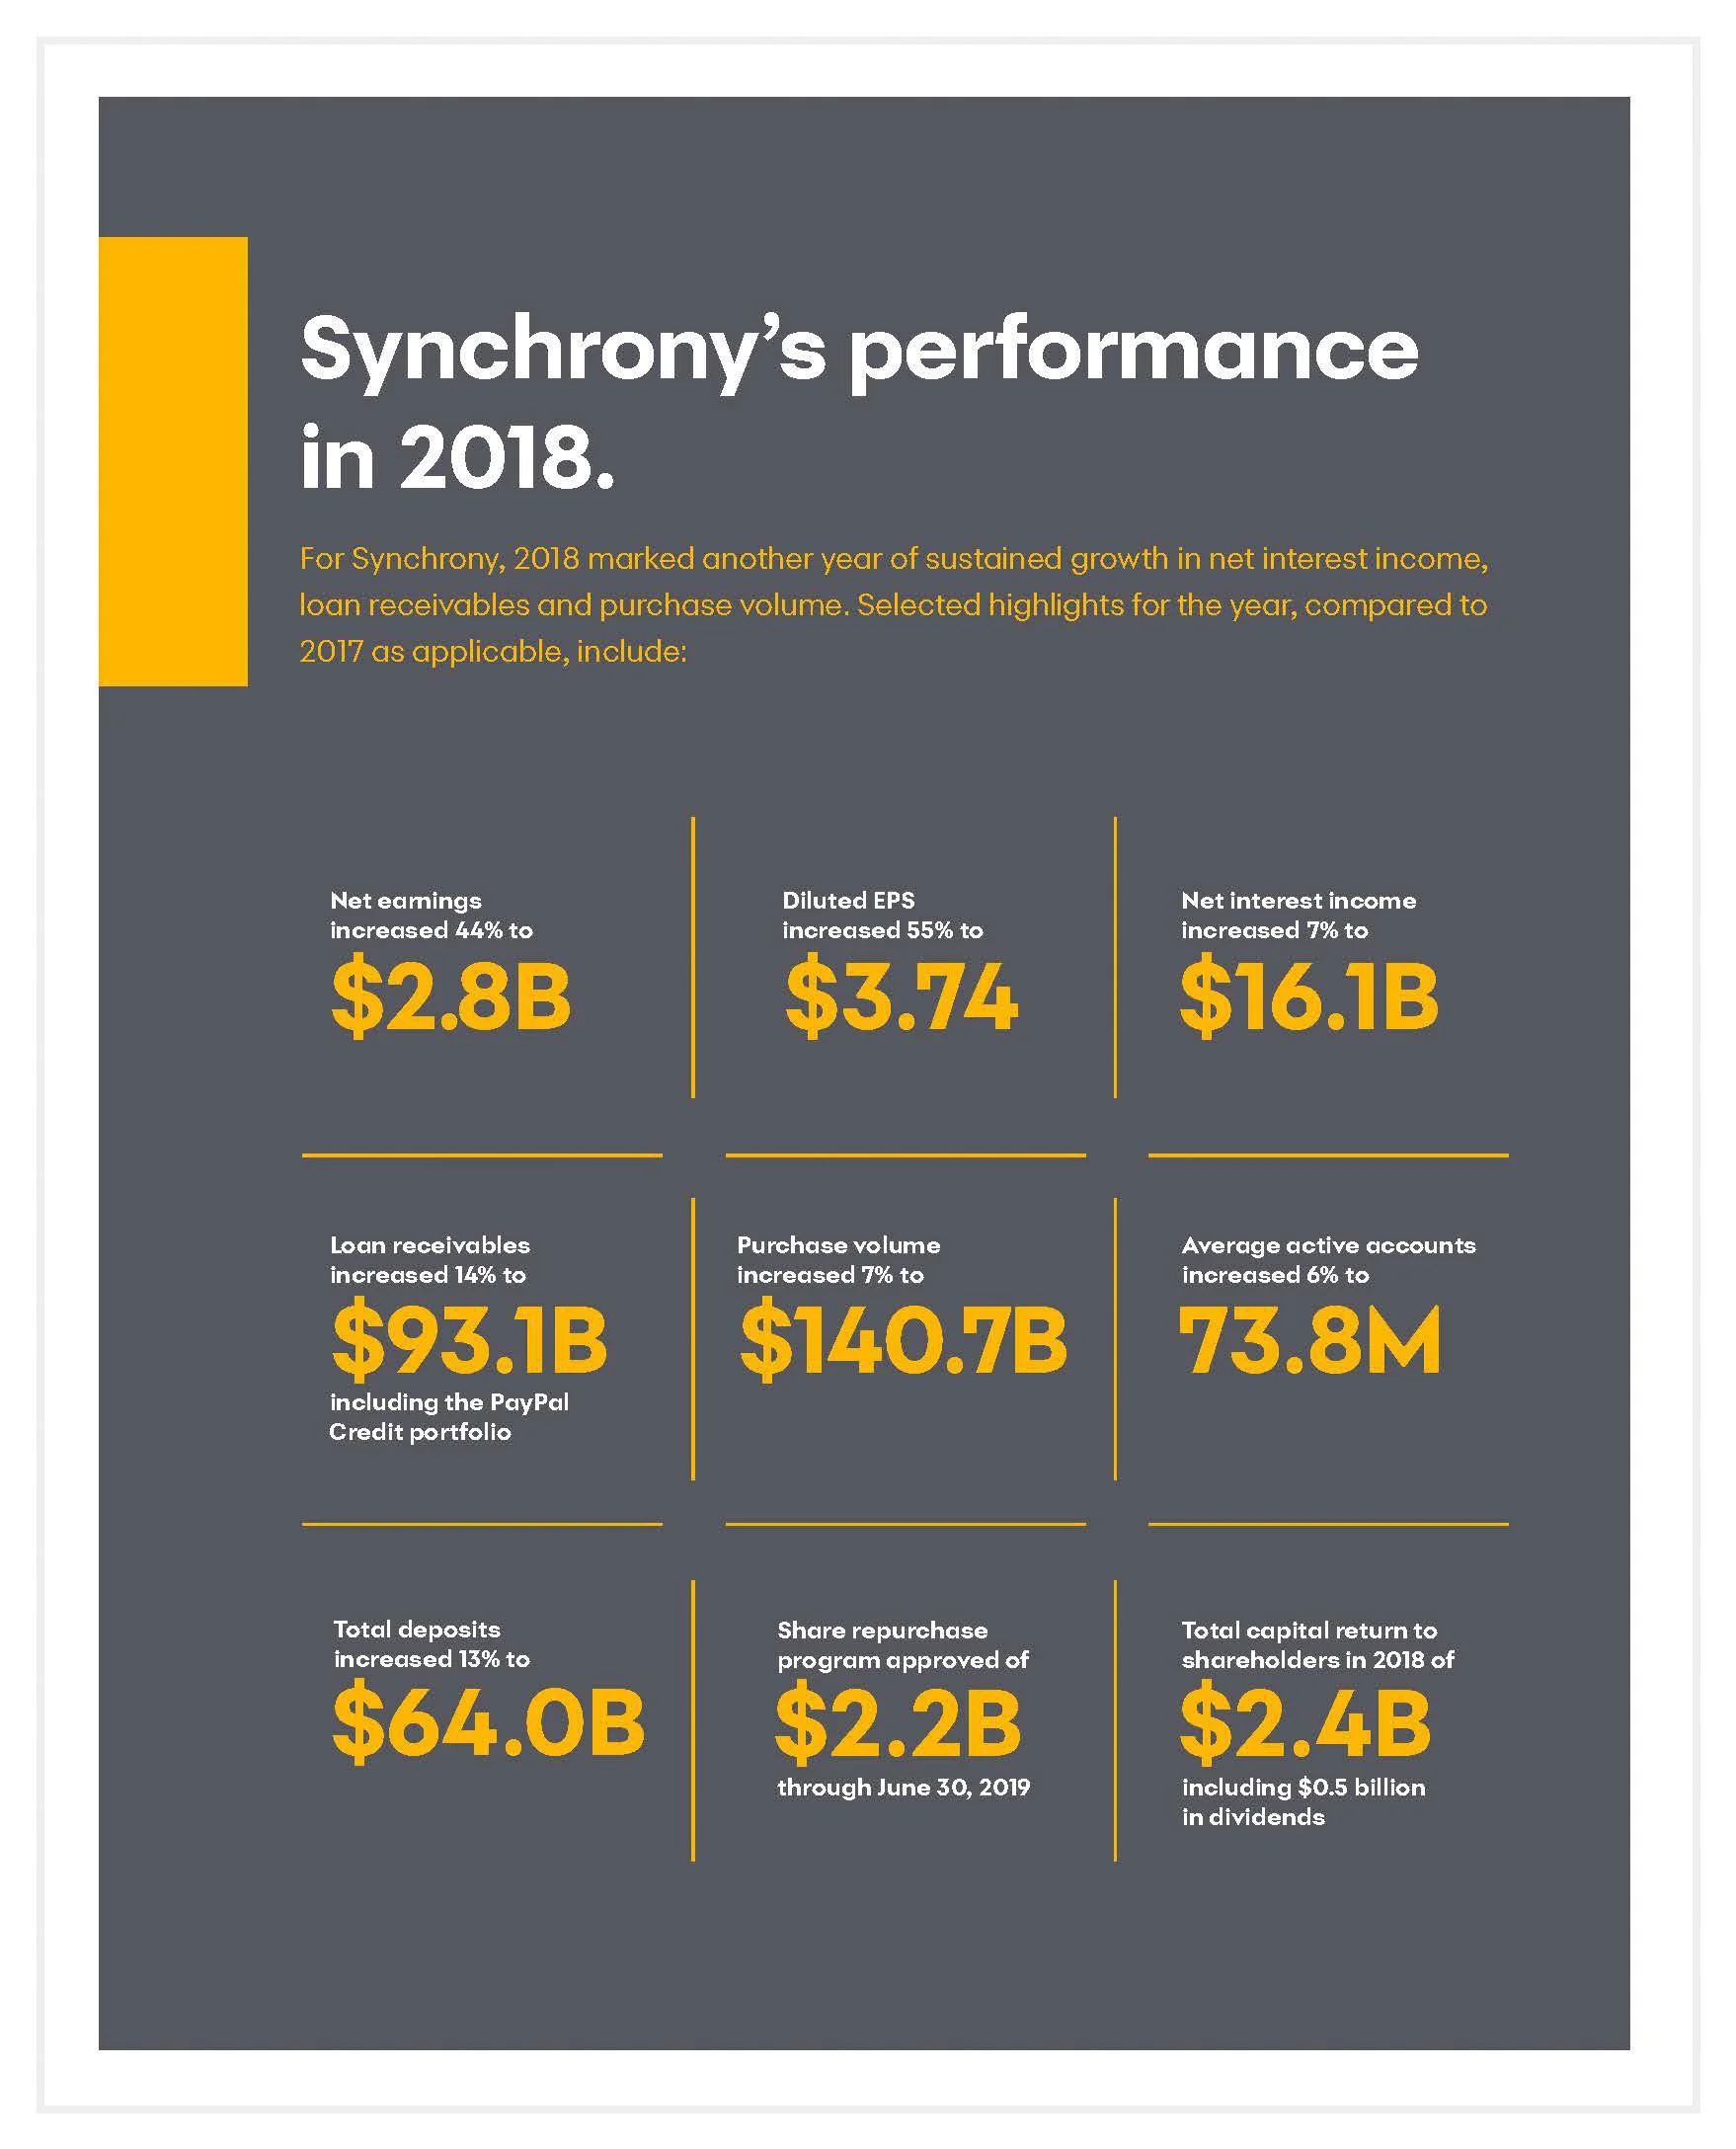
10-K wraps today have come a long way from their humble start. And that’s only natural, as a letter alone can’t tell the complete story. Increasingly, companies are using data visualization techniques like charts, graphs, and infographics to present financial information in a more digestible and engaging format. If you’re not adding these elements to your 10-K wrap, you should be. Because, it helps readers quickly grasp key insights and trends. Plus, they break up text-heavy letters, making them more inviting.
Here are some examples for inspiration: